PSAT 2019 scores are in. What have we learned?
More test versions
One change we noticed was that the College Board appears to have used at least 4 versions of the PSAT on each test date. From our records, this looks like a first for the College Board. And it’s a great improvement! The SAT has faced security issues and question leaks, some of which come from students in different time zones reporting test questions online. Using multiple versions on the same day is a great way to minimize cheating. Way to go, College Board!
Harsher curve than last year—but only for some students
There’s been a lot of talk about this year’s curve being harsher than last year. That’s definitely true for some, but not for others. It all depends on when you took the PSAT last year.
Every year the PSAT is given on two dates. The test on October 10 last year was a pretty standard curve. The test on October 24, though, was the harshest curve ever seen on the new PSAT. For example, in Math missing just two questions dropped a student down to a 660 on that test!
This year the two dates had very similar curves. This year’s curve was harsher if you compare it to last year’s October 10 test, but easier if compared to last year’s October 24 test.
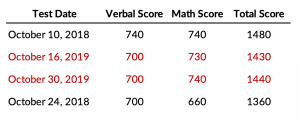
For example, take a student who missed two questions in each section (Reading, Writing, and Math). We’ve put them in order of highest to lowest score:
You can see that this year’s curve was harsher compared to last year’s October 10 exam, but more forgiving for those who took last year’s October 24 test.
Harsher curves over time
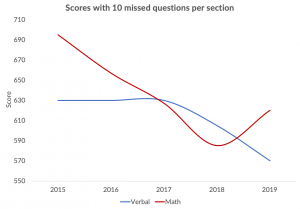
Despite the recent year-to-year fluctuation, scales for both sections have gotten harsher since the PSAT changed in 2015.
For example, take a student who missed 10 questions in each section. Note: To make the trend clearer, we’ve created a single score for each year by averaging the scores across multiple days in that year.

Math has been on a downward slope for a while, though this year jumped a bit, mostly due to the rebound after last year’s anomalous curve on October 24. Verbal scores, on the other hand, have seen a dramatic decline in the last couple of years.
Individual points on the graph change a little depending on whether you’re a high or low scorer, but across all score bands the downward trend over time is clear.
What should you do about harsher curves?
There’s not much individual students can do other than to remain vigilant, prepare for the test, and learn strategies to limit careless mistakes on test day.
It is not readily apparent why the curve has become so harsh—College Board has released no official statement. Regardless of the cause, it appears that the curve is here to stay, and we expect next year’s curves to be similar.
While the curves on recent PSATs have certainly been severe, remember that you are not alone. This trend is affecting students around the world, and universities are aware of this fact. Rest assured that we at ArborBridge will always keep you up to date on the latest developments surrounding the PSAT.
Data for this post gathered from The College Board’s Understanding PSAT/NMSQT Scores 2019 report.


